
旭日图
旭日图(Sunburst)由多层的环形图组成,在数据结构上,内圈是外圈的父节点。因此,它既能像饼图一样表现局部和整体的占比,又能像矩形树图一样表现层级关系。
引入相关文件
旭日图是 ECharts 4.0 新增的图表类型,需要引入完整版的 echarts.min.js
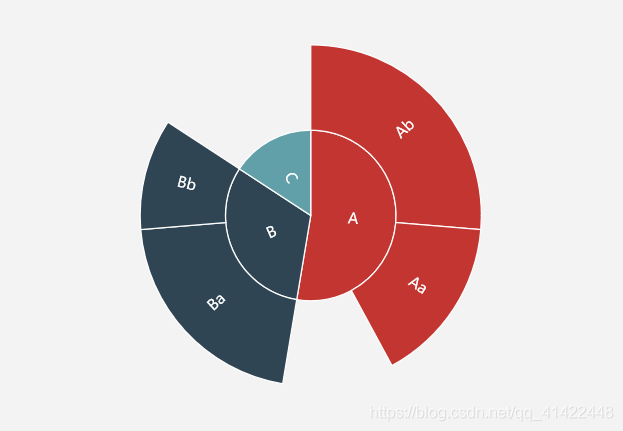
最简单的旭日图
创建旭日图需要在 series 配置项中声明类型为 ‘sunburst’ 的系列,并且以树形结构声明其 data:
<!DOCTYPE HTML>
<html>
<head>
    <meta http-equiv="Content-Type" content="text/html; charset=UTF-8">
    <title>最简单的旭日图</title>
    <script type="text/javascript" src="../js/jquery-3.4.1.min.js"></script>
    <script type="text/javascript" src="../js/echarts.min.js"></script>
</head>
<body>
<div id="main" style="width:400px;height:300px;"></div>
<script type="text/javascript">
    var myChart = echarts.init(document.getElementById('main'));

    var option = {
        series: {
            type: 'sunburst',
            data: [{
                name: 'A',
                value: 10,
                children: [{
                    value: 3,
                    name: 'Aa'
                }, {
                    value: 5,
                    name: 'Ab'
                }]
            }, {
                name: 'B',
                children: [{
                    name: 'Ba',
                    value: 4
                }, {
                    name: 'Bb',
                    value: 2
                }]
            }, {
                name: 'C',
                value: 3
            }]
        }
    };
    myChart.setOption(option);
</script>
</body>
</html>
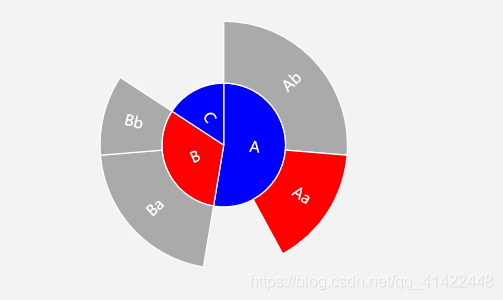
颜色等样式调整
默认情况下会使用全局调色盘 color 分配最内层的颜色,其余层则与其父元素同色。在旭日图中,扇形块的颜色有以下三种设置方式:
- 在 series.data.itemStyle 中设置每个扇形块的样式;
- 在 series.levels.itemStyle 中设置每一层的样式;
- 在 series.itemStyle 中设置整个旭日图的样式。
上述三者的优先级是从高到低的,也就是说,配置了 series.data.itemStyle 的扇形块将会覆盖 series.levels.itemStyle 和 series.itemStyle 的设置。
下面,我们将整体的颜色设为灰色 ‘#aaa’,将最内层的颜色设为蓝色 ‘blue’,将 Aa、B 这两块设为红色 ‘red’。
<!DOCTYPE HTML>
<html>
<head>
    <meta http-equiv="Content-Type" content="text/html; charset=UTF-8">
    <title>颜色等样式调整</title>
    <script type="text/javascript" src="../js/jquery-3.4.1.min.js"></script>
    <script type="text/javascript" src="../js/echarts.min.js"></script>
</head>
<body>
<div id="main" style="width:400px;height:300px;"></div>
<script type="text/javascript">
    var myChart = echarts.init(document.getElementById('main'));

    var option = {
        series: {
            type: 'sunburst',
            data: [{
                name: 'A',
                value: 10,
                children: [{
                    value: 3,
                    name: 'Aa',
                    itemStyle: {
                        color: 'red'
                    }
                }, {
                    value: 5,
                    name: 'Ab'
                }]
            }, {
                name: 'B',
                children: [{
                    name: 'Ba',
                    value: 4
                }, {
                    name: 'Bb',
                    value: 2
                }],
                itemStyle: {
                    color: 'red'
                }
            }, {
                name: 'C',
                value: 3
            }],
            itemStyle: {
                color: '#aaa'
            },
            levels: [{
                // 留给数据下钻的节点属性
            }, {
                itemStyle: {
                    color: 'blue'
                }
            }]
        }
    };

    myChart.setOption(option);
</script>
</body>
</html>
按层配置样式
旭日图是一种有层次的结构,为了方便同一层样式的配置,我们提供了 levels 配置项。它是一个数组,其中的第 0 项表示数据下钻后返回上级的图形,其后的每一项分别表示从圆心向外层的层级。
例如,假设我们没有数据下钻功能,并且希望将最内层的扇形块的颜色设为红色,文字设为蓝色,可以这样设置:
series: {
    // ...
    levels: [
        {
            // 留给数据下钻点的空白配置
        },
        {
            // 最靠内测的第一层
            itemStyle: {
                color: 'red'
            },
            label: {
                color: 'blue'
            }
        },
        {
            // 第二层 ...
        }
    ]
}
在实际使用的过程中,你会发现按层配置样式是一个很常用的功能,能够很大程度上提高配置的效率。
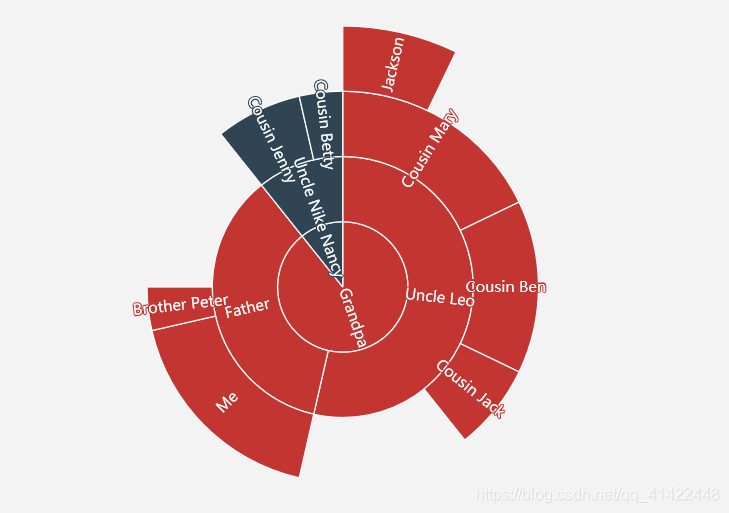
数据下钻
旭日图默认支持数据下钻,也就是说,当点击了扇形块之后,将以该扇形块的数据作为根节点,便于进一步了解该数据的细节。
<!DOCTYPE HTML>
<html>
<head>
    <meta http-equiv="Content-Type" content="text/html; charset=UTF-8">
    <title>最简单的旭日图</title>
    <script type="text/javascript" src="../js/jquery-3.4.1.min.js"></script>
    <script type="text/javascript" src="../js/echarts.min.js"></script>
</head>
<body>
<div id="main" style="width:400px;height:300px;"></div>
<script type="text/javascript">
    var myChart = echarts.init(document.getElementById('main'));

    var data = [{
        name: 'Grandpa',
        children: [{
            name: 'Uncle Leo',
            value: 15,
            children: [{
                name: 'Cousin Jack',
                value: 2
            }, {
                name: 'Cousin Mary',
                value: 5,
                children: [{
                    name: 'Jackson',
                    value: 2
                }]
            }, {
                name: 'Cousin Ben',
                value: 4
            }]
        }, {
            name: 'Father',
            value: 10,
            children: [{
                name: 'Me',
                value: 5
            }, {
                name: 'Brother Peter',
                value: 1
            }]
        }]
    }, {
        name: 'Nancy',
        children: [{
            name: 'Uncle Nike',
            children: [{
                name: 'Cousin Betty',
                value: 1
            }, {
                name: 'Cousin Jenny',
                value: 2
            }]
        }]
    }];

    option = {
        series: {
            type: 'sunburst',
            // highlightPolicy: 'ancestor',
            data: data,
            radius: [0, '90%'],
            label: {
                rotate: 'radial'
            }
        }
    };

    myChart.setOption(option);
</script>
</body>
</html>
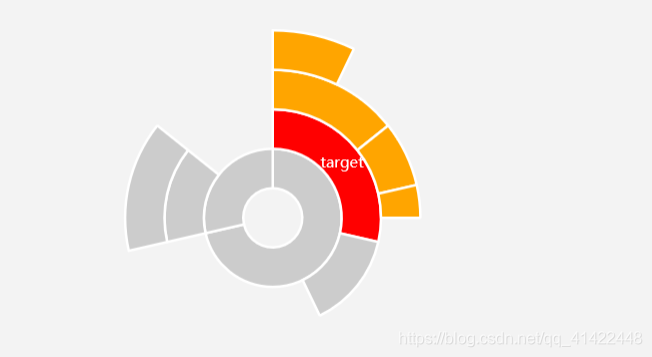
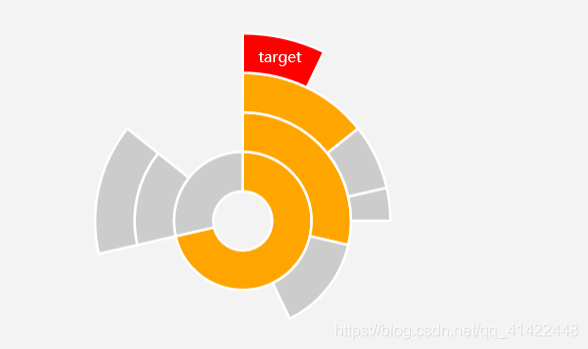
高亮相关扇形块
旭日图支持鼠标移动到某扇形块时,高亮相关数据块的操作,可以通过设置 highlightPolicy,包括以下几种高亮方式:
- descendant’(默认值):高亮鼠标移动所在扇形块与其后代元素;
- ancestor’:高亮鼠标所在扇形块与其祖先元素;
- self’:仅高亮鼠标所在扇形块;
- none’:不会淡化(downplay)其他元素。
上面提到的“高亮”,对于鼠标所在的扇形块,会使用 emphasis 样式;对于其他相关扇形块,则会使用 highlight 样式。通过这种方式,可以很方便地实现突出显示相关数据的需求。
具体来说,对于配置项:
itemStyle: {
    color: 'yellow',
    borderWidth: 2,
    emphasis: {
        color: 'red'
    },
    highlight: {
        color: 'orange'
    },
    downplay: {
        color: '#ccc'
    }
}
highlightPolicy为 descendant或 ancestor的效果分别为:
descendant
<!DOCTYPE HTML>
<html>
<head>
    <meta http-equiv="Content-Type" content="text/html; charset=UTF-8">
    <title>颜色等样式调整</title>
    <script type="text/javascript" src="../js/jquery-3.4.1.min.js"></script>
    <script type="text/javascript" src="../js/echarts.min.js"></script>
</head>
<body>
<div id="main" style="width:400px;height:300px;"></div>
<script type="text/javascript">
    var myChart = echarts.init(document.getElementById('main'));

    option = {
        silent: true,
        series: {
            radius: ['15%', '95%'],
            center: ['50%', '60%'],
            type: 'sunburst',
            sort: null,
            highlightPolicy: 'descendant',
            data: [{
                value: 10,
                children: [{
                    name: 'target',
                    value: 4,
                    children: [{
                        value: 2,
                        children: [{
                            value: 1
                        }]
                    }, {
                        value: 1
                    }, {
                        value: 0.5
                    }]
                }, {
                    value: 2
                }]
            }, {
                value: 4,
                children: [{
                    children: [{
                        value: 2
                    }]
                }]
            }],
            label: {
                normal: {
                    rotate: 'none',
                    color: '#fff'
                }
            },
            levels: [],
            itemStyle: {
                color: 'yellow',
                borderWidth: 2
            },
            emphasis: {
                itemStyle: {
                    color: 'red'
                }
            },
            highlight: {
                itemStyle: {
                    color: 'orange'
                }
            },
            downplay: {
                itemStyle: {
                    color: '#ccc'
                }
            }
        }
    };

    setTimeout(function () {
        myChart.dispatchAction({
            type: 'sunburstHighlight',
            targetNodeId: 'target'
        });
    });


    myChart.setOption(option);
</script>
</body>
</html>
ancestor
<!DOCTYPE HTML>
<html>
<head>
    <meta http-equiv="Content-Type" content="text/html; charset=UTF-8">
    <title>ancestor</title>
    <script type="text/javascript" src="../js/jquery-3.4.1.min.js"></script>
    <script type="text/javascript" src="../js/echarts.min.js"></script>
</head>
<body>
<div id="main" style="width:400px;height:300px;"></div>
<script type="text/javascript">
    var myChart = echarts.init(document.getElementById('main'));

    option = {
        silent: true,
        series: {
            radius: ['15%', '95%'],
            center: ['50%', '60%'],
            type: 'sunburst',
            sort: null,
            highlightPolicy: 'descendant',
            data: [{
                value: 10,
                children: [{
                    name: 'target',
                    value: 4,
                    children: [{
                        value: 2,
                        children: [{
                            value: 1
                        }]
                    }, {
                        value: 1
                    }, {
                        value: 0.5
                    }]
                }, {
                    value: 2
                }]
            }, {
                value: 4,
                children: [{
                    children: [{
                        value: 2
                    }]
                }]
            }],
            label: {
                normal: {
                    rotate: 'none',
                    color: '#fff'
                }
            },
            levels: [],
            itemStyle: {
                color: 'yellow',
                borderWidth: 2
            },
            emphasis: {
                itemStyle: {
                    color: 'red'
                }
            },
            highlight: {
                itemStyle: {
                    color: 'orange'
                }
            },
            downplay: {
                itemStyle: {
                    color: '#ccc'
                }
            }
        }
    };

    setTimeout(function () {
        myChart.dispatchAction({
            type: 'sunburstHighlight',
            targetNodeId: 'target'
        });
    });


    myChart.setOption(option);
</script>
</body>
</html>
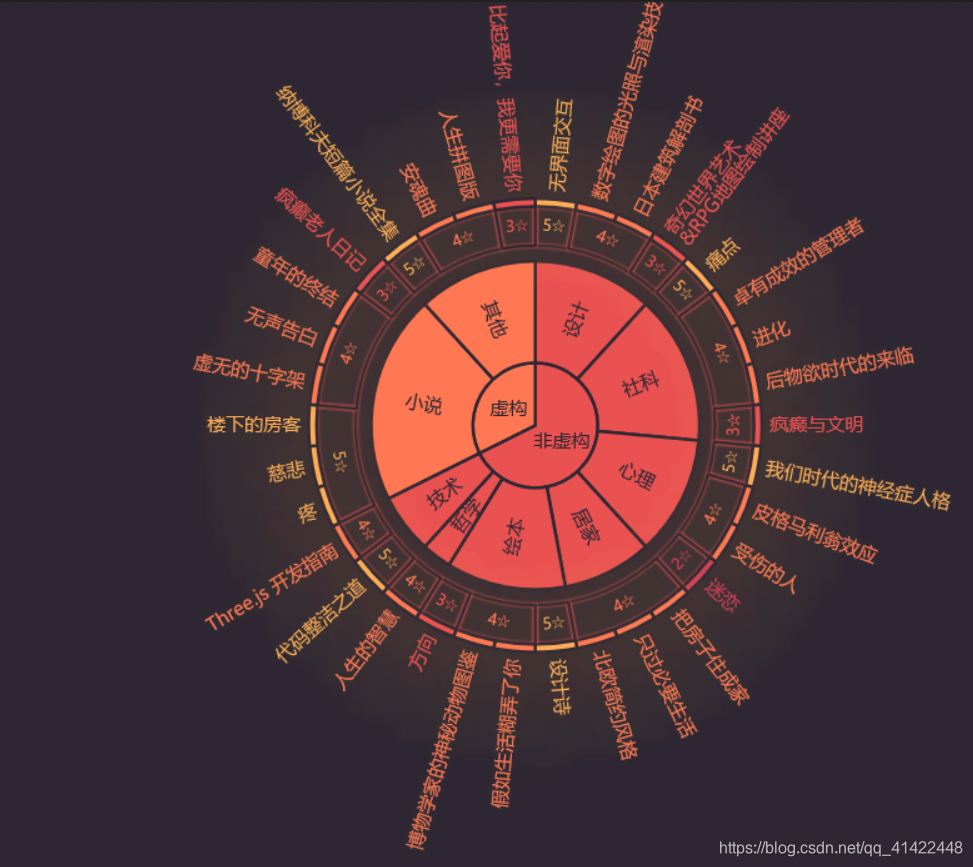
复杂的旭日图
<!DOCTYPE HTML>
<html>
<head>
<meta http-equiv="Content-Type" content="text/html; charset=UTF-8">
<title>ancestor</title>
<script type="text/javascript" src="../js/jquery-3.4.1.min.js"></script>
<script type="text/javascript" src="../js/echarts.min.js"></script>
</head>
<body>
<div id="main" style="width:800px;height:600px;"></div>
<script type="text/javascript">
var myChart = echarts.init(document.getElementById('main'));
var colors = ['#FFAE57', '#FF7853', '#EA5151', '#CC3F57', '#9A2555'];
var bgColor = '#2E2733';
var itemStyle = {
star5: {
color: colors[0]
},
star4: {
color: colors[1]
},
star3: {
color: colors[2]
},
star2: {
color: colors[3]
}
};
var data = [{
name: '虚构',
itemStyle: {
color: colors[1]
},
children: [{
name: '小说',
children: [{
name: '5☆',
children: [{
name: '疼'
}, {
name: '慈悲'
}, {
name: '楼下的房客'
}]
}, {
name: '4☆',
children: [{
name: '虚无的十字架'
}, {
name: '无声告白'
}, {
name: '童年的终结'
}]
}, {
name: '3☆',
children: [{
name: '疯癫老人日记'
}]
}]
}, {
name: '其他',
children: [{
name: '5☆',
children: [{
name: '纳博科夫短篇小说全集'
}]
}, {
name: '4☆',
children: [{
name: '安魂曲'
}, {
name: '人生拼图版'
}]
}, {
name: '3☆',
children: [{
name: '比起爱你,我更需要你'
}]
}]
}]
}, {
name: '非虚构',
itemStyle: {
color: colors[2]
},
children: [{
name: '设计',
children: [{
name: '5☆',
children: [{
name: '无界面交互'
}]
}, {
name: '4☆',
children: [{
name: '数字绘图的光照与渲染技术'
}, {
name: '日本建筑解剖书'
}]
}, {
name: '3☆',
children: [{
name: '奇幻世界艺术\n&RPG地图绘制讲座'
}]
}]
}, {
name: '社科',
children: [{
name: '5☆',
children: [{
name: '痛点'
}]
}, {
name: '4☆',
children: [{
name: '卓有成效的管理者'
}, {
name: '进化'
}, {
name: '后物欲时代的来临',
}]
}, {
name: '3☆',
children: [{
name: '疯癫与文明'
}]
}]
}, {
name: '心理',
children: [{
name: '5☆',
children: [{
name: '我们时代的神经症人格'
}]
}, {
name: '4☆',
children: [{
name: '皮格马利翁效应'
}, {
name: '受伤的人'
}]
}, {
name: '3☆',
}, {
name: '2☆',
children: [{
name: '迷恋'
}]
}]
}, {
name: '居家',
children: [{
name: '4☆',
children: [{
name: '把房子住成家'
}, {
name: '只过必要生活'
}, {
name: '北欧简约风格'
}]
}]
}, {
name: '绘本',
children: [{
name: '5☆',
children: [{
name: '设计诗'
}]
}, {
name: '4☆',
children: [{
name: '假如生活糊弄了你'
}, {
name: '博物学家的神秘动物图鉴'
}]
}, {
name: '3☆',
children: [{
name: '方向'
}]
}]
}, {
name: '哲学',
children: [{
name: '4☆',
children: [{
name: '人生的智慧'
}]
}]
}, {
name: '技术',
children: [{
name: '5☆',
children: [{
name: '代码整洁之道'
}]
}, {
name: '4☆',
children: [{
name: 'Three.js 开发指南'
}]
}]
}]
}];
for (var j = 0; j < data.length; ++j) {
var level1 = data[j].children;
for (var i = 0; i < level1.length; ++i) {
var block = level1[i].children;
var bookScore = [];
var bookScoreId;
for (var star = 0; star < block.length; ++star) {
var style = (function (name) {
switch (name) {
case '5☆':
bookScoreId = 0;
return itemStyle.star5;
case '4☆':
bookScoreId = 1;
return itemStyle.star4;
case '3☆':
bookScoreId = 2;
return itemStyle.star3;
case '2☆':
bookScoreId = 3;
return itemStyle.star2;
}
})(block[star].name);
block[star].label = {
color: style.color,
downplay: {
opacity: 0.5
}
};
if (block[star].children) {
style = {
opacity: 1,
color: style.color
};
block[star].children.forEach(function (book) {
book.value = 1;
book.itemStyle = style;
book.label = {
color: style.color
};
var value = 1;
if (bookScoreId === 0 || bookScoreId === 3) {
value = 5;
}
if (bookScore[bookScoreId]) {
bookScore[bookScoreId].value += value;
}
else {
bookScore[bookScoreId] = {
color: colors[bookScoreId],
value: value
};
}
});
}
}
level1[i].itemStyle = {
color: data[j].itemStyle.color
};
}
}
option = {
backgroundColor: bgColor,
color: colors,
series: [{
type: 'sunburst',
center: ['50%', '48%'],
data: data,
sort: function (a, b) {
if (a.depth === 1) {
return b.getValue() - a.getValue();
}
else {
return a.dataIndex - b.dataIndex;
}
},
label: {
rotate: 'radial',
color: bgColor
},
itemStyle: {
borderColor: bgColor,
borderWidth: 2
},
levels: [{}, {
r0: 0,
r: 40,
label: {
rotate: 0
}
}, {
r0: 40,
r: 105
}, {
r0: 115,
r: 140,
itemStyle: {
shadowBlur: 2,
shadowColor: colors[2],
color: 'transparent'
},
label: {
rotate: 'tangential',
fontSize: 10,
color: colors[0]
}
}, {
r0: 140,
r: 145,
itemStyle: {
shadowBlur: 80,
shadowColor: colors[0]
},
label: {
position: 'outside',
textShadowBlur: 5,
textShadowColor: '#333',
},
downplay: {
label: {
opacity: 0.5
}
}
}]
}]
};
myChart.setOption(option);
</script>
</body>
</html>
欢迎查看我的CSDN博客:Welcome To Ryan’s Home

|

|

|